Difference between revisions of "Dashboard"
From Spiffy Stores Knowledge Base
| Line 7: | Line 7: | ||
The Spiffy Store Toolbox Dashboard gives you an overview of your store's operations. | The Spiffy Store Toolbox Dashboard gives you an overview of your store's operations. | ||
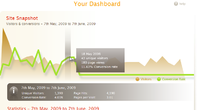
| − | In the main body of the page you will find a '''Site Snapshot''' which contains an interactive graph showing the number of visitors to your site and the corresponding conversion rates for each day | + | In the main body of the page you will find a '''Site Snapshot''' which contains an interactive graph showing the number of visitors to your site and the corresponding conversion rates for each day over the last month. |
| + | |||
| + | By hovering your mouse over any portion of the graph, you will see a pop-up tab showing some detailed statistics for that day. | ||
| + | |||
| + | <div class="cb"></div> | ||
| + | <gallery widths=200px heights=200px class="right"> | ||
| + | File:Help Dashboard2.png|Statistics Summary | ||
| + | </gallery> | ||
| + | |||
| + | Underneath the main graph is a summary of the statistics for your site for the past month. | ||
| − | |||
[[Category:Help]] | [[Category:Help]] | ||
Revision as of 13:18, 23 February 2010
Your Dashboard
Dashboard Statistics

The Spiffy Store Toolbox Dashboard gives you an overview of your store's operations.
In the main body of the page you will find a Site Snapshot which contains an interactive graph showing the number of visitors to your site and the corresponding conversion rates for each day over the last month.
By hovering your mouse over any portion of the graph, you will see a pop-up tab showing some detailed statistics for that day.
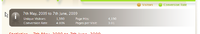
Statistics Summary
Underneath the main graph is a summary of the statistics for your site for the past month.